Question
The graph below shows the number of primary school students playing in the field after school between 2018 and 2020.
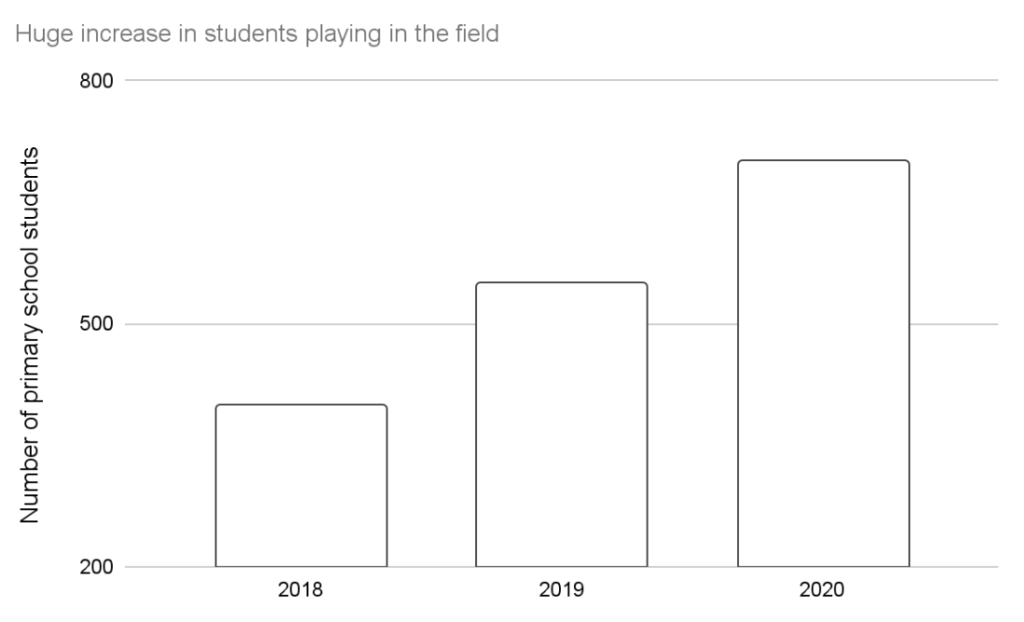
(a) State one way in which the graph is misleading and explain why it is misleading.
(b) Do you agree that the percentage of primary school students playing in the field has been increasing between 2018 and 2020?
Solution
(a) The graph doesn’t start from 0 on the vertical axis. This makes it seem like the number of students tripled from 2018 to 2020.
(b) Disagree. The total enrolment each year is not provided, so we are unable to calculate the percentage.